Finding Profit Leaks Across SKUs and Sales Channels: A Guide for Businesses
If you sell a lot of SKUs, you probably have profit links. Learn how to find them.
If your company carries a lot of SKUs, it can be difficult to track the profitability of each item. Sure, you can see the overall profit margin at the company level, but finding profit leaks requires a deeper look.
First, let me remind you of the formula for Gross Margin since I’ll give examples using this metric.
Gross Margin = [Sales – Cost of Goods Sold] / Sales
The gross margin calculates profit as a percentage of sales. The higher the value, the better. Suppose at the company level, you have the following financial values:
Sales = $20,000,000
COGS = $7,000,000
Then Profit = $13,000,000 and Gross Margin = $13M / $20M = 65%.
That’s a nice gross margin, but at this level, you can’t tell if you have any profit leaks!
To look at the gross margin in detail, we can calculate a GM% for every item the company offers. Let’s look at 5 items as an example. In reality, I tend to work with over 100 items.
What can we tell from these values?
The gross margin % is quite good for 4 out of 5 items in 2024.
The gross margin % for item 101 is slowly falling. This gives us a hint that costs are creeping up for that item, the selling price has been reduced or both.
Our biggest concern is item 104 where the gross margin has fallen over the years and is now negative. It’s a profit leak!
You can see that looking at the company net income statement, you would never know you had a profit leak. You have to go deeper.
In fact, most retail companies not only sell a lot of different SKUs, they also sell those SKUs through different channels. Prices tend to be different across channels.
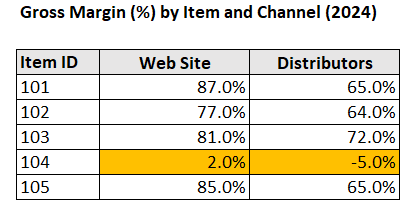
Let’s suppose the company we’re analyzing sells direct to customers through their web site and they also sell through distributors. We can calculate the gross margin for every item across each selling channel to gain more insights into possible profit leaks.
What can we tell from these values?
The web site produces higher gross margins than selling through distributors. This is normal since distributors are paid a commission and act as a middle-man. As the name suggests, a commission is paid for making your products available to the distributor’s audience.
We can see that an issue exists with item 104 both on the website and in the distribution channel. The distribution channel is certainly a profit leak. While the web site margin isn’t negative, it is certainly so small that it’s not contributing to your bottom line in a good way.
So, now what do we do?
First, we want to check the data. For item 104, the poor gross margin value could be caused by a simple typo in the cost field in your computer system and online store. I always hope it’s that simple to fix a bad gross margin!
If not, a deeper dive into the costs of continuing to sell item 104 is in order. Have costs been rising without a corresponding price increase? Do you sell enough of 104 to make it worth the effect of addressing the situation or is this an item which sells such low volume that it should be discontinued?
Do we just look for negative margins?
No. Our biggest concerns are certainly the items which produce a negative gross margin as that clearly indicates that the cost of the item exceeds its revenue. It’s a true profit leak. But we also want to set a target gross margin to meet or exceed. What the value of that target is will depend on your industry.
We set a target value because if you look at your Net Income statement, the gross margin is just a starting point after which we subtract other types of costs until we reach the bottom line. We need our SKUs to start with a high enough gross margin that, by the time we subtract all of our additional costs, we’re still a company with a good bottom line!
Conclusion
In summary, uncovering profit leaks requires looking beyond aggregated financial metrics and drilling down to the SKU-and-channel level. By calculating gross margin percentages for each product across all sales channels, businesses can expose hidden inefficiencies such as rising costs, incorrect pricing data, or underperforming SKUs that may be quietly eroding profitability.
Addressing these insights and validating data accuracy, reviewing cost structures, or discontinuing low-margin items is essential for safeguarding margins and sustaining a healthy bottom line. Adopting a disciplined, data-informed approach ensures profitability isn’t just visible in aggregate, but truly robust at the operational level.
Resources
Download a template to find Profit Leaks: Gross Margin % by Item and Channel (Good for smaller businesses if your ERP doesn't do this for you.


